


Digital dynamometer/indicator operating instructions
The Station Road Steam DDI system - operating instructions
This document is intended as a guide to setting up and using the Digital Dynamometer/Indicator (DDI). It gives detailed instructions on how to connect it to an Android device, take readings from an engine under test and download this data to a PC for display and analysis.
It is assumed that the user is familiar with the basic concepts of engine testing by use of a dynamometer or steam indicator.
Supplied in the box
Indicator unit with integral drawbar
sensor
Index sensor with magnet
Pressure sensor (optional)
Charger
In addition, you will need an Android device - typically a smart tablet or tablet computer - running Android 2.0 or later software. In this document we refer to this device as a tablet, menu options are referred to in italics below.
The unit has two operating modes:
1. As a dynamometer, monitoring the speed and drawbar pull of a working locomotive. It does this using an integral drawbar sensor which couples to the back of the engine under test and a wheel position sensor, which detects the passing of a magnet attached to a wheel, just like an electronic bicycle odometer.
2.With an optional pressure sensor, as
an indicator, monitoring pressure in the cylinder during the working cycle and
producing a diagram to show the results graphically. The pressure sensor is
attached to one end of the cylinder (typically replacing one of the draincocks)
and a position (or index) sensor attached to a part of the motion (typically a
driving wheel, although the crosshead would work equally well) to detect the
piston reaching its dead centre position.
Getting started
1. Charge the indicator:
It can be used whilst charging - if switched off it will charge fully in about
10 hours, sufficient to power it for around 12 hours continuous use. Note that
the connector is centre positive - the unit is protected against reverse
polarity, however will not charge if connected wrongly.
2. Download the TKP Indicator/Drawbar app - it is available as a free download at
the Google Playstore, search for "TKP". The app will
request permission to use Bluetooth and external storage when installing.
When installed, running it will show the opening screen:

3. Pair indicator with the tablet:
i.Switch on the indicator, check the ‘Bluetooth Connected’ LED flashes.
ii.On the tablet, under Settings/wireless & network settings/bluetooth settings, scan for the indicator device. Its four-digit address is written on the indicator case. When found, for example ‘Firefly 6472’, pair with this device. The PIN code is ‘1234’, the tablet will report ‘paired but not connected’ and is now ready to run the TKP app.
4. Run the TKP app and connect the tablet to the indicator:
i.Switch on the indicator, check the ‘Bluetooth Connected’ LED flashes.
ii.Start the app - if necessary it will ask permission to turn Bluetooth on
iii.Select Connect a device from the menu, and then select the appropriate paired device, for example ‘Firefly 6472’ - the app will usually report ‘connecting’ and then, after a few seconds, ‘connected’.
iv.Sometimes, depending on the exact tablet model, more than one connection attempt is required; also, in some cases, a ‘Bluetooth pairing request’ is reported even though the module has already been paired to this tablet. If this happens, respond to the request with the PIN code ‘1234’ as above.
v.When the module is connected to the app, the ‘Bluetooth Connected’ led remains on, and the ‘Data xfer’ led flashes once per second as data is transferred between module and tablet.
vi.The app will report the indicator’s
battery voltage and charge state on the display in yellow, changing to red when
the indicator battery is low.
5. Connect and calibrate the drawbar sensor:
i.Disable both sensors in the setup/indicator setup menu
ii.Enable drawbar in the setup/drawbar setup menu, select low range in the setup/drawbar setup/select drawbar range menu
iii.Select Calibrate from the
main menu - this will zero the drawbar value and store its setting in the
tablet.
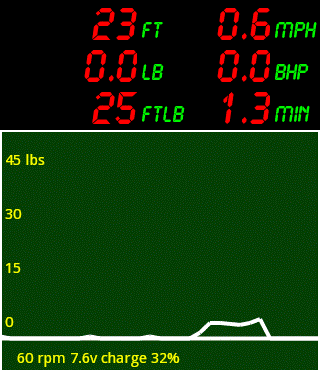
Quit the menu to return to the main app page. Now, as a load is applied to the drawbar, the screen will show the last 30 seconds of drawbar history, as in the example below. Note that the tablet stores drawbar data on the tablet's SD card for the entire length of the run (up to 60 minutes), which can be downloaded to a PC.

6. Connect and test the index sensor:
i.With the system running and configured as described in section 5 above, plug the supplied index sensor into ‘Index’ socket on the indicator.
ii.Bringing the magnet in and out of proximity of the sensor will cause its LED and the "Index" LED on the indicator to flash - if a load is applied to the drawbar at the same time, the app will show a screen similar to the one below.

iii.Attach the sensor to a part of the
locomotive where it can detect the magnet, typically to one of the driving
wheels.
7. Connect and test the pressure sensor:
If the optional pressure sensor has been supplied for recording cylinder
pressure, plug it into the P1 socket on
the indicator. From the Set up/Indicator
setup menu enable sensor 1 and select indicator spring "Low".
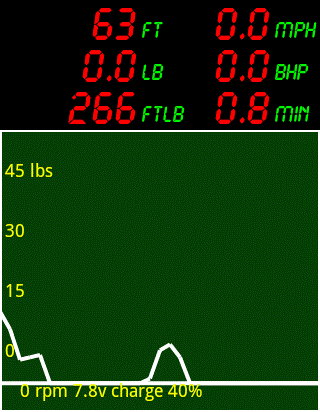
i.Returning to the main screen, a diagram similar to that shown below will be displayed. The drawbar load (7.1 lb) is still displayed, but the graph is now displaying pressure in psi on the vertical scale instead of lbs of drawbar pull. If the pressure sensor is gently pressurised, the line in the diagram will move away from its normal atmospheric line position. If the index sensor is active, then as before rpm (59 rpm), speed (0.6mph) , current brake horsepower (0.01 bhp) and elapsed distance (278 ft) will be shown.

8. Set up for measurement of indicator diagrams:
Attach the index sensor by means of a suitable bracket to a part of the engine
frame in a position where it can detect the passing of a magnet stuck to the
back of a driving wheel. Position the magnet so that the sensor is triggered as
the piston reaches the end of its stroke.
Attach the pressure sensor to one end of the cylinder under test. The supplied
sensor has a 1/4" x 40 fitting and is mounted on a short syphon tube. The
most convenient method of mounting is to remove one drain cock - alternatively
a hole can be drilled and tapped in the end cover. If using a drain cock hole,
check that the piston doesn't cover the hole at the end of its stroke which
will lead to misleading results. Care should be taken to ensure that the pipe
is either clear of condensed water or oil, or completely filled to avoid
oscillations in the measured pressure.
In the Engineering data setup page, enter Operator parameters and Engine
data - the wheel diameter, crank length, connecting rod length and number
of cylinders are required.
In engineering data/indicator
setup/select indicator spring, select a pressure range appropriate for the
engine under test.
Indicator diagrams may be taken with the engine under test powered by steam or
air, and with the engine either running on a track or rolling road. On a
rolling road, it may be found advantageous to apply the engine brakes lightly
in order to get an informative indicator diagram. Indicator diagrams may be
saved in the tablet for later download as described below. A typical indicator
diagram is shown below
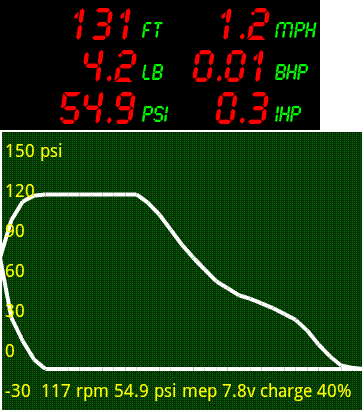
It is sometimes convenient to freeze the display for closer
examination. This is achieved by tapping the screen in the data area at the top
of the screen, causing the data text to be displayed in red and the screen
display to freeze. Note that internal logging of data continues during a
display freeze, it is only the display which is frozen. Tap the screen again to
return to a live display.
An atmospheric line may also be captured and saved when the engine is idle.
9.Saving
data and file structures: spreadsheets
Data stored during a test may be
saved to the tablet’s external storage (usually an SD card).
1.1. To save the current data, select save diagram. This creates two files, with identical sequential file numbers - these automatically increment from 0 to 99, allowing a total of 100 sets of test data to be stored. The first file is the current screen shot, named TKP_Picture_nn.png - the example shown below is taken with the indicator working in drawbar mode:
The second file is a data file, one of two types depending
on whether the system is in use as an indicator or as a dynamometer.
Dynamometer files are named as TKP_Dynamometer_nn.txt, Indicator diagram files as TKP_Indicator_nn.txt. Both file types are simple text
files containing the appropriate captured data (drawbar or pressure) and all
the relevant setup data, including the filename, date and time, and all
user-input parameters such as wheel diameter, cylinder bore, number of
cylinders etc.
Indicator diagram files store just one indicator diagram, so that apart from
the setup data listed above, there are 64 values in each file representing the
pressure readings for one cycle. Thus the file has a fixed length.
Dynamometer files, on the other hand, store the whole of a trip, which may be
up to 60 minutes long. For each second of the run, both drawbar load and
cumulative distance run are recorded, giving a file whose size depends on the
length of the run.
1.3. The data can be transferred to a pc for display and analysis in a spreadsheet. The macro-based Excel templates which can be used to produce tabulated data from a data set can be downloaded below, along with sets of test data.
1.4. The dynamometer sample test data in TKP_Dynamometer_2.txt are shown below:
1.5. The indicator test data in TKP_Indicator_1.txt are shown below:
1.6. The dynamometer spreadsheet is TKP_Dynamometer.xlsm - this requires macros to be enabled in Excel. TKP_Dynamometer_2.xlsx shows it used to produce tabulated results from the sample dynamometer test data TKP_Dynamometer_2.txt.
1.7. The sample indicator spreadsheet is TKP_Indicator_1.xlsx, created manually from TKP_Indicator_1.txt, showing the file structure.
Summary of menu functions
1. Connect a device
1.1. This is used to connect the Android tablet to a DDI module. A list of paired devices is displayed, and the users selects the desired pair.
2. Save diagram
2.1. This saves the current data set (Indicator or Dynamometer) to the Android tablet’s SD card for later download to a user’s pc.
2.2. The number of files which may be saved is 100, subject to space being available on the device’s SD card.
3. Setup
3.1. This gives access to all the user Engineering data settings
3.1.1. Select distance units(for display) displays the trip distance in miles or feet, without changing the internal storage.
3.1.2. Drawbar setup.
Enable the drawbar, select High/Low range and enter calibration scale factors
for each range.
The calibration scale factors, one for each range, are used to set the drawbar
to match a known test load. With the test load connected, the scale factor is
varied until the reported load matched the test load - typical scale factors
are 200 for the high range, and 60 for the low range. These values are preset
on first installation of the app.If a tablet is connected to more
than one DDI module, the calibration factors, and the calibration zero, (see
4.1 below), will need to be changed for
each module.
3.1.3. Indicator setup. Enable one or both pressure sensor inputs, and select the required spring for the engine under test (note that currently only one pressure sensor input is supported)
3.1.4. Engine data
3.1.4.1.Engine name, engine serial number, the Steam/air flag and the working pressure value are all information-only values.
3.1.4.2.Of the numeric values, wheel diameter is used to calculate distance from the index sensor, and the others are used to calculate mean effective pressure (MEP), brake horsepower (BHP - calculated from the drawbar data) and indicated horsepower (IHP - calculated from the cylinder pressure date) and also, in the exported files, to allow user-generated geometric correction to be applied to the indicated data.
3.1.5. Operator data
3.1.5.1.Operator name and Company name are information-only text fields. They are stored and exported in the saved files.
4. Calibrate
4.1. This sets the internal zero reference for the drawbar sensor. It should be used when a module is first connected, and also when the drawbar range is changed. It reports the internal offset as a number, usually in the range 10-25.
5. Make discoverable
5.1. Some Android tablets require a device to be made discoverable before they can pair. This function makes the tablet discoverable for 300 seconds, after asking for permission. Not often needed.
6. Clear trip
6.1. This clears the tablet’s internal storage of the current trip data, setting distance travelled, work done and elapsed time to zero.
6.2. It should be noted that this function will lose the current stored data set if it has not already been stored with ‘Save diagram’
6.3. The maximum trip time is 60 minutes.


Station Road Steam Limited
Registered office address: Unit 16-17 Moorlands Trading Estate, Metheringham, Lincoln, Lincolnshire, LN4 3HX.
Company registration number: 4496691
VAT Number: GB803743934
Copyright © Station Road Steam Ltd 2001-2026
- Terms of business
- Shipping
- Returns
- Privacy policy
- Email: info@stationroadsteam.com
- Tel: 01526 328772